Bias in figure skating judging
Published on 20th of June, 2020.
My wife is very enthuisiastic about figure skating. She often mentions that the judging is biased, in the sense that many judges give higher scores to athletes from their own country, and lower scores to athletes from other countries.
This doesn’t sound too surprising, but I wondered if it is actually true. Can I show that there is a statistically significant bias in figure skating scoring?
The data
To answer this question I need to have a dataset with scores of many skaters, including the nationalities of all the skaters and judges. The ISU publishes these results in PDF files on their website. Before the 2016/2017 season they randomized the order of the judges’ scores for each skater, so these seasons are not usable. Additionally they stopped publishing the nationalities of judges since the current 2019/2020 season. Therefore I downloaded all the scores of the 2016/2017 through 2018/2019 seasons from the isu websites. In a separate post I will go more into detail in how to mine PDF data like this.
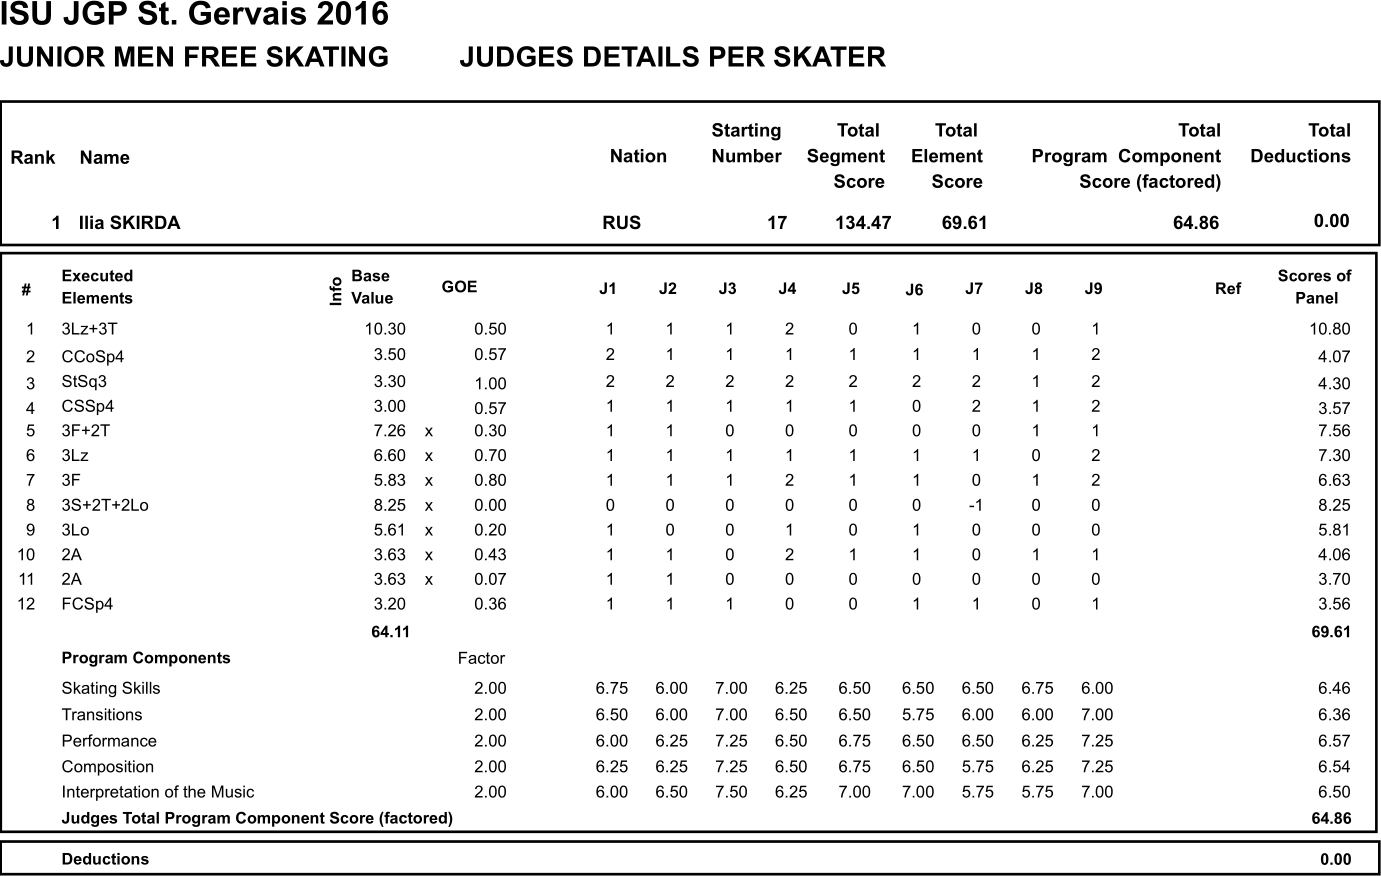
A typical piece of a PDF file looks like this:
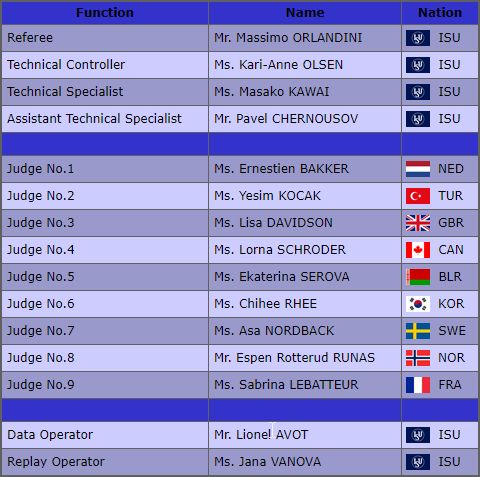
Additionally on the website we get the following information regarding the judges presented in a table like this:
Results
This is all we need. We can now build a table comparing the scoring of a particular judge and the average of all judges together. We split this between scoring for technical elements (which should be more objective) and scoring program components (which should be more subjective). In the example above the skater is from Russia, and we see that Judge No.1 (who is from the Netherlands) gives an average GOE of for the technical elements, compared to the average of all judges of . This means that her scores are above the average. This in itself doesn’t mean much, but if we observe that there is a consistent bias over many different cases where a Dutch judge is judging a Russian skater, then we have identified a bias.
Then this is what we do: for each pair of countries we collect all the cases where a judge from country A judged a skater from country B. Then we record how their scoring was compared to the average scoring of all the judges. Finally we look at the distribution of these deviations from the average. Taking the example above, in my data there were 49 cases where a Dutch judge judged a Russian skater, and the distribution looks like this:
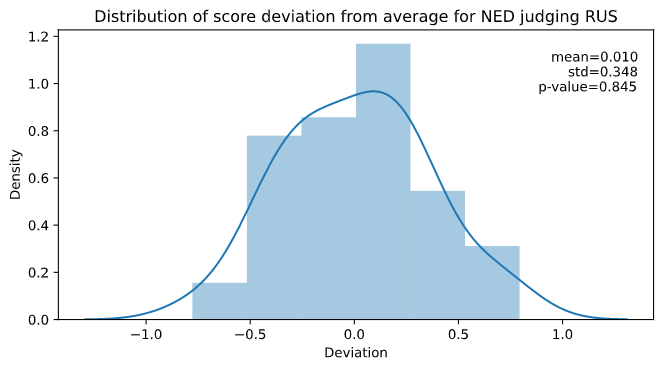
Here we see that the distribution is roughly that of a normal distribution. Furthermore the mean is not statistically different from ; the -value is . For us to conclude that there is a statistically significant bias this value should at the least be below . Since we have many pairs of countries (2586 to be precise), we might even put this criterion significantly lower (say 1/1000) to avoid false positives.
We can thus conclude that there is no statistically significant bias when it comes to Dutch judges scoring Russian skaters. But what if we look at say Russian judges scoring their own skaters? Well, then we see a very different story. We have 519 cases of this happening, and the distribution of score deviation looks like this:
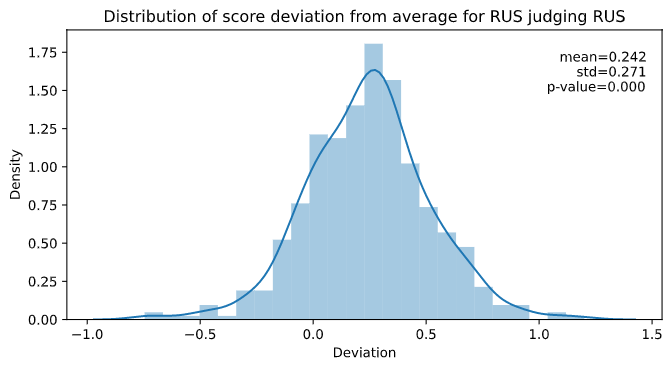
We see that the far majority (82%) of the time, the Russian judges gave higher scores to Russian skaters compared to their peers. In fact the mean deviation is (which is quite significant), with a -value of , which is most certainly statistically significant. So there you have it, Russian judges tend to score their own athletes significantly higher. But Russia is not the only country of doing this; every major figure skating country has such a bias. Out of those, the bias of Japan is the least with points, and that of France the highest with . All of this is for the technical scores, but the component scores paint a very similar picture.
And we don’t just see that some countries like themselves, we also see that many countries tend to score their rivals significantly lower. If we set the barrier for statistical significance at a -value of , then we find 29 country pairs with scores significantly less than 0 (and also 29 pairs with scores more than 0). With very few exceptions all the cases where a country gives significantly lower scores to another country, then this happens between a former Warsaw pact country and a non-Warsaw pact country. One can thus see that cold war politics are still very much alive in the world of figure skating.
For reference here is a table with the pairs of countries where the -value is less than , sorted by the average deviation in GOE scores. If we increase the -value to , the number of country pairs with a negative/positive deviation increases to 100/127 respectively, but this likely also includes some false positives.
| Country A | Country B | GOE Deviation | # Samples | std | p-value |
|---|---|---|---|---|---|
| GEO | GER | -0.423535 | 13 | 0.291439 | 0.000292112 |
| FIN | POL | -0.394558 | 7 | 0.129526 | 0.000298878 |
| GEO | JPN | -0.391477 | 23 | 0.369426 | 5.66014e-05 |
| NOR | SVK | -0.347513 | 15 | 0.304064 | 0.000767944 |
| DEN | JPN | -0.287993 | 19 | 0.256627 | 0.000156087 |
| GEO | CAN | -0.278147 | 23 | 0.321245 | 0.000519587 |
| GEO | FRA | -0.262415 | 17 | 0.236376 | 0.000411082 |
| USA | POL | -0.234252 | 37 | 0.319543 | 9.28026e-05 |
| FIN | RUS | -0.223771 | 116 | 0.459913 | 8.11565e-07 |
| CAN | UKR | -0.212031 | 54 | 0.294583 | 2.83725e-06 |
| USA | BLR | -0.210608 | 54 | 0.30442 | 5.83674e-06 |
| USA | ESP | -0.209474 | 31 | 0.269294 | 0.000185776 |
| GEO | USA | -0.199728 | 48 | 0.303747 | 4.34335e-05 |
| USA | HUN | -0.198829 | 32 | 0.301136 | 0.000890425 |
| UKR | CAN | -0.196541 | 72 | 0.327044 | 3.11877e-06 |
| ITA | UKR | -0.190304 | 27 | 0.249708 | 0.000628967 |
| NOR | RUS | -0.167886 | 42 | 0.265585 | 0.000223648 |
| GER | RUS | -0.146194 | 216 | 0.365862 | 1.73015e-08 |
| BLR | CAN | -0.144693 | 57 | 0.273774 | 0.00021738 |
| HKG | RUS | -0.140813 | 19 | 0.147647 | 0.000757625 |
| USA | RUS | -0.127477 | 487 | 0.346152 | 3.90599e-15 |
| RUS | KOR | -0.11664 | 69 | 0.246956 | 0.000226837 |
| CZE | USA | -0.103901 | 131 | 0.327618 | 0.000426771 |
| RUS | JPN | -0.093866 | 227 | 0.289868 | 2.11539e-06 |
| KOR | RUS | -0.0924231 | 199 | 0.329138 | 0.000108097 |
| CZE | CAN | -0.0915781 | 117 | 0.282166 | 0.000671065 |
| RUS | USA | -0.088714 | 400 | 0.293915 | 3.75673e-09 |
| CHN | CAN | -0.0817519 | 167 | 0.278467 | 0.000216408 |
| RUS | CAN | -0.072195 | 313 | 0.268176 | 3.0339e-06 |
| CZE | CZE | 0.10548 | 70 | 0.231123 | 0.000317855 |
| FRA | JPN | 0.111209 | 102 | 0.285243 | 0.000162456 |
| HUN | RUS | 0.132175 | 89 | 0.327803 | 0.000282576 |
| JPN | JPN | 0.156523 | 237 | 0.327147 | 3.22684e-12 |
| GER | GER | 0.163652 | 84 | 0.248169 | 4.80504e-08 |
| AUT | AUT | 0.168284 | 41 | 0.272225 | 0.000348661 |
| BLR | UKR | 0.172673 | 27 | 0.234309 | 0.000876659 |
| RUS | BLR | 0.172728 | 48 | 0.261251 | 4.0039e-05 |
| ITA | ITA | 0.191333 | 83 | 0.257742 | 2.20598e-09 |
| FRA | SUI | 0.196021 | 15 | 0.153326 | 0.000291446 |
| USA | USA | 0.201305 | 390 | 0.344327 | 1.16234e-26 |
| CAN | CAN | 0.202964 | 309 | 0.328201 | 1.87699e-23 |
| SLO | SLO | 0.220573 | 14 | 0.183307 | 0.00080383 |
| CHN | CHN | 0.237789 | 126 | 0.27782 | 1.30817e-16 |
| RUS | RUS | 0.242122 | 519 | 0.270732 | 4.12722e-68 |
| ISR | ISR | 0.246661 | 36 | 0.278365 | 7.70606e-06 |
| KOR | KOR | 0.255873 | 65 | 0.302727 | 4.86167e-09 |
| FRA | FRA | 0.255881 | 149 | 0.334381 | 1.63481e-16 |
| LTU | LTU | 0.264828 | 18 | 0.183077 | 1.53876e-05 |
| GEO | GEO | 0.31548 | 18 | 0.180445 | 1.46255e-06 |
| UZB | UZB | 0.327713 | 14 | 0.180962 | 1.91363e-05 |
| ESP | ESP | 0.339558 | 27 | 0.278435 | 1.40513e-06 |
| KAZ | KAZ | 0.345734 | 30 | 0.314278 | 1.9616e-06 |
| MEX | MEX | 0.34907 | 15 | 0.247822 | 0.000118384 |
| EST | EST | 0.369731 | 28 | 0.258569 | 5.41857e-08 |
| TUR | TUR | 0.435335 | 25 | 0.278468 | 6.76828e-08 |
| BLR | BLR | 0.455432 | 38 | 0.316918 | 1.57049e-10 |
| HUN | HUN | 0.471011 | 34 | 0.344248 | 4.63145e-09 |
| UKR | UKR | 0.505353 | 41 | 0.363255 | 6.7634e-11 |
Other posts you may like
Rik Voorhaar © 2025